AI-Assisted Rice Mill Production & Energy Optimization
A high-volume rice mill required real-time visibility into production, labour efficiency, and energy cost across three energy sources. Hexitronics built dashboards that combine production, time, and energy data to help the owner and operator make faster decisions.
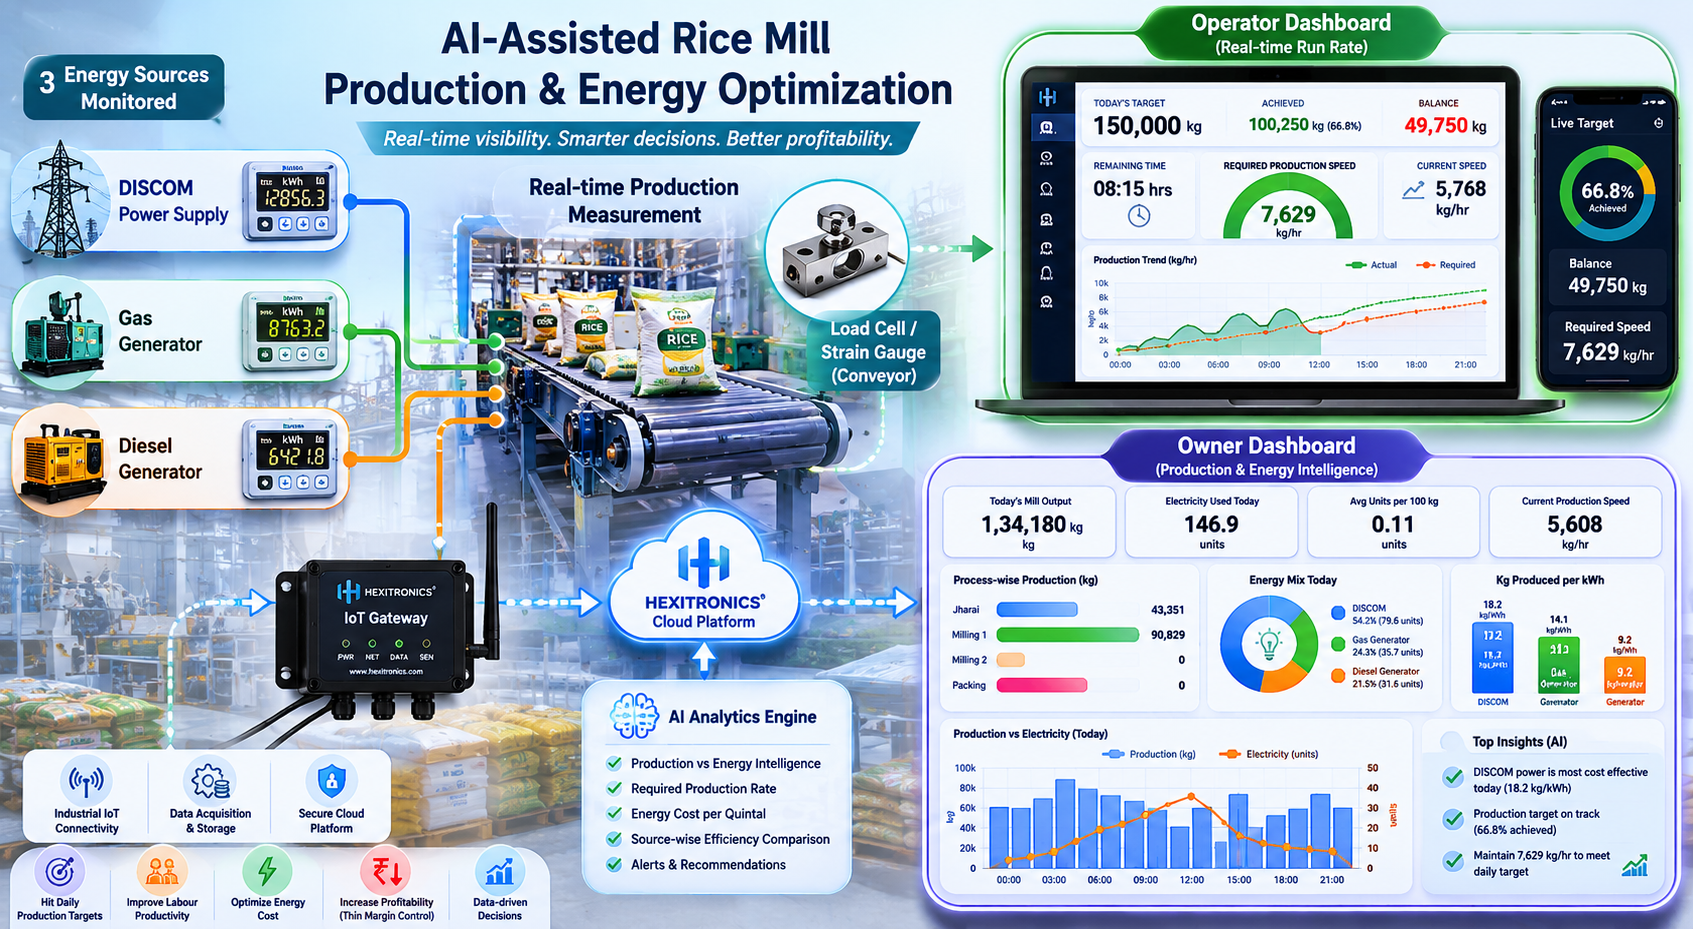
Production target, energy cost, and dashboard intelligence in one view.
Project Overview
This rice mill operates under a contract manufacturing model and runs production across three different energy sources: West Bengal DISCOM power supply, gas generator, and diesel generator. In a business where the profit margin may be as small as ₹0.50 per kg, even minor inefficiencies in labour or energy usage can directly affect profitability.
The owner needed two views: one for the operator to maintain production pace through the day, and one for management to understand production cost, energy efficiency, and the best source of energy in terms of output per unit of power.
Operator Objective
Show daily target, current output, balance to be achieved, and the production speed required for the remaining time of the day.
Owner Objective
Show the same production data along with energy cost, source-wise comparison, and production efficiency against each energy source.
The Challenge
The mill owner was concerned about two things:
Labour Efficiency
How to measure labour payment versus time-based production so that the plant can maintain output without wasting shift hours.
Energy Efficiency
How to calculate production against energy consumption when the plant runs on three different sources, each with a different cost and output profile.
Traditional reporting would not be enough. The owner needed real-time insight, not after-the-fact logs.
How We Solved It
Hexitronics deployed an integrated production and energy monitoring system that connected plant energy sources with real-time production measurement.
Energy Meters
Installed for DISCOM, gas generator, and diesel generator.
Load Cell / Strain Gauge
Measured finished and packed rice on the conveyor in real time.
IoT Device
Collected energy and production data continuously from the plant.
Dashboard Logic
Plotted production, energy consumption, and time trends together.
AI-Like Insights
Calculated the required production rate and source-wise cost impact.
Operator Dashboard
The operator dashboard is designed like a live chase board. It shows the target production for the day, total produced so far, balance target, and the production speed needed to reach the day’s goal.
Daily Target
Displays the total production target for the current day.
Actual vs Remaining
Shows current output and how much production is still pending.
Required Speed
Calculates the pace needed for the remaining time of the shift.
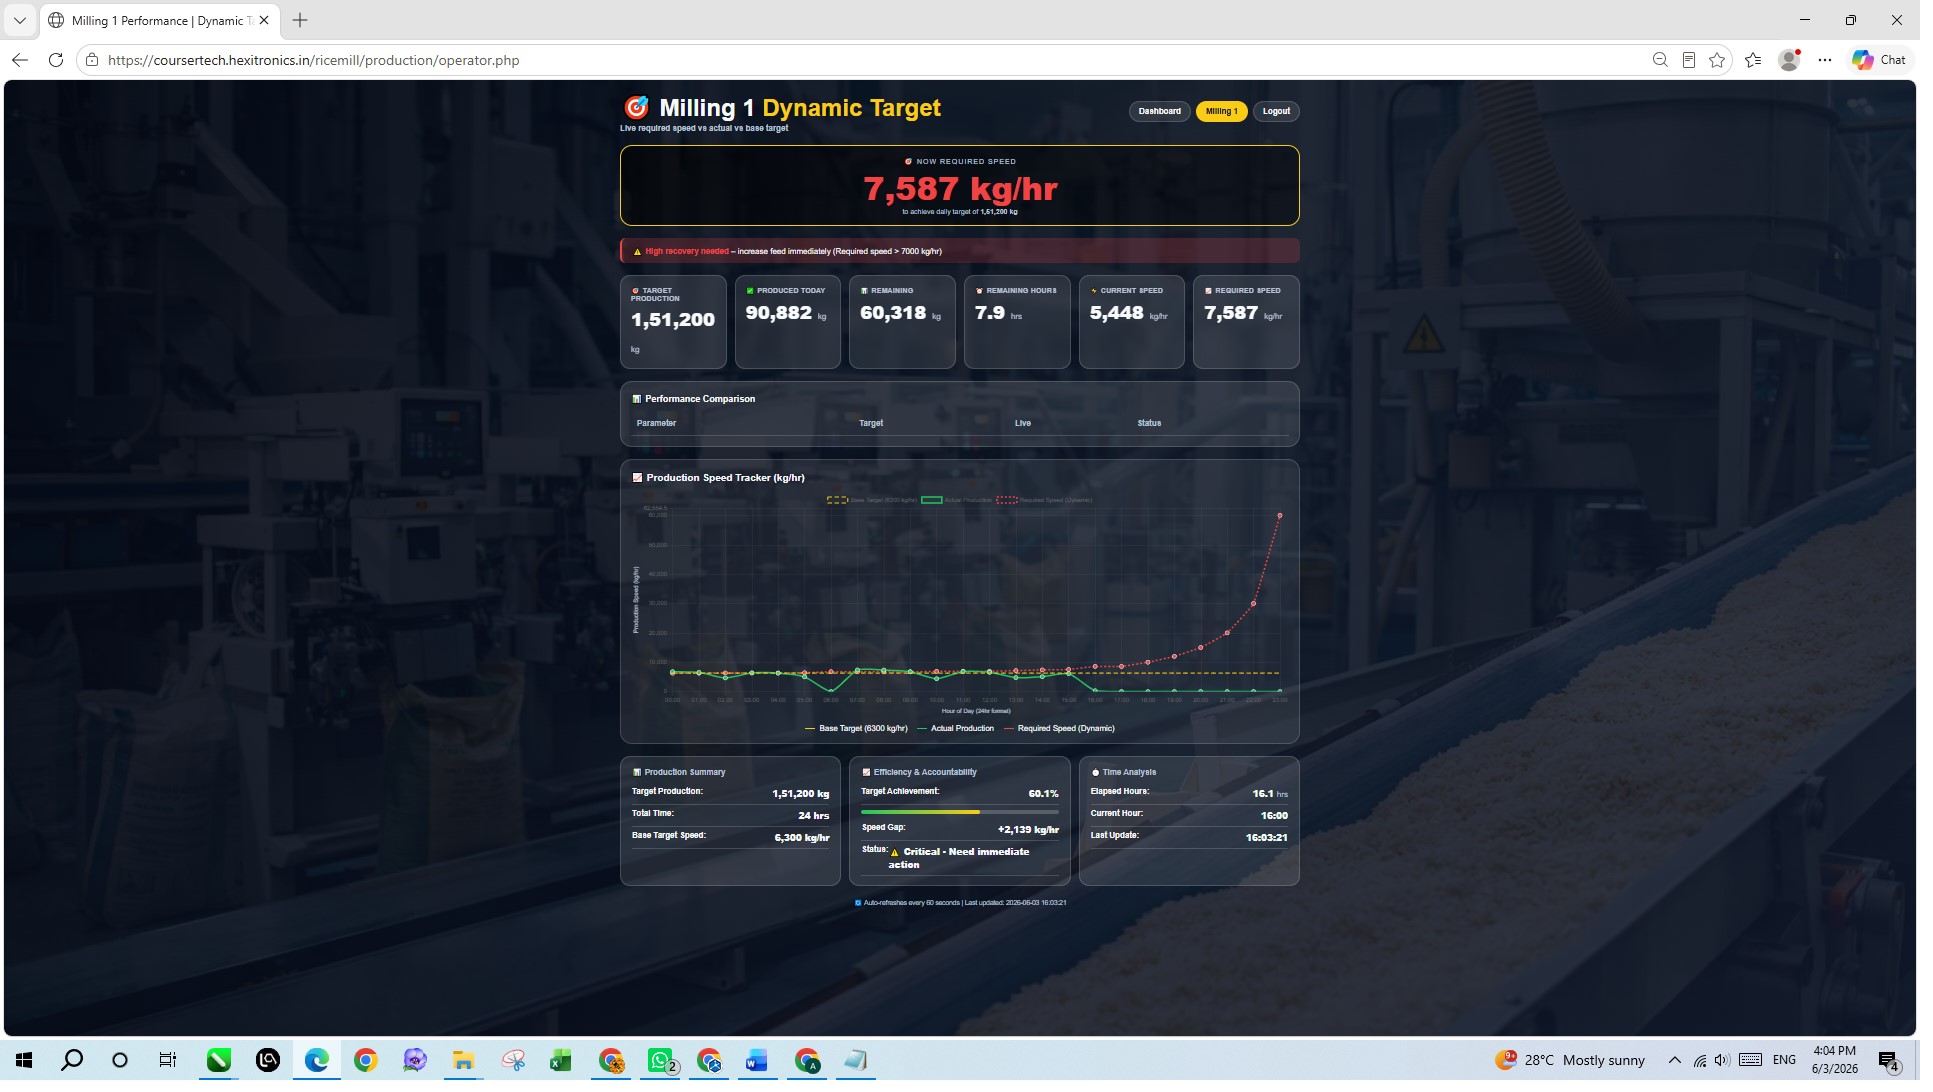
Operator View
Production target, production achieved, balance quantity, and required production speed presented in one live screen.
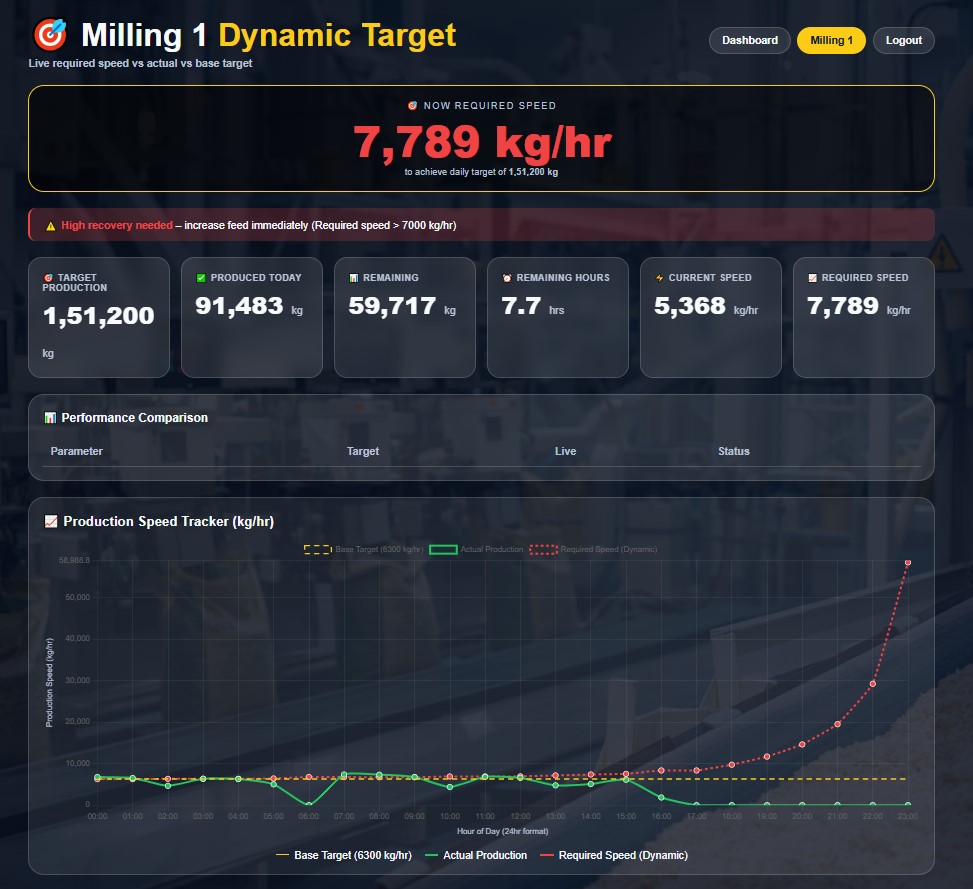
Dynamic Rate Tracking
The required production speed behaves like a cricket run-rate chase, helping the team stay alert and maintain pace.
Owner Dashboard
The owner dashboard combines production with energy consumption and helps compare the cost effectiveness of DISCOM power, gas generator, and diesel generator in terms of kg produced per unit of energy.
Production Intelligence
- Total production
- Speed of current milling line
- Shift-wise and line-wise output
- Balance against target
Energy Intelligence
- Units consumed from each source
- Cost per unit
- kg per unit of energy
- Source-wise productivity comparison
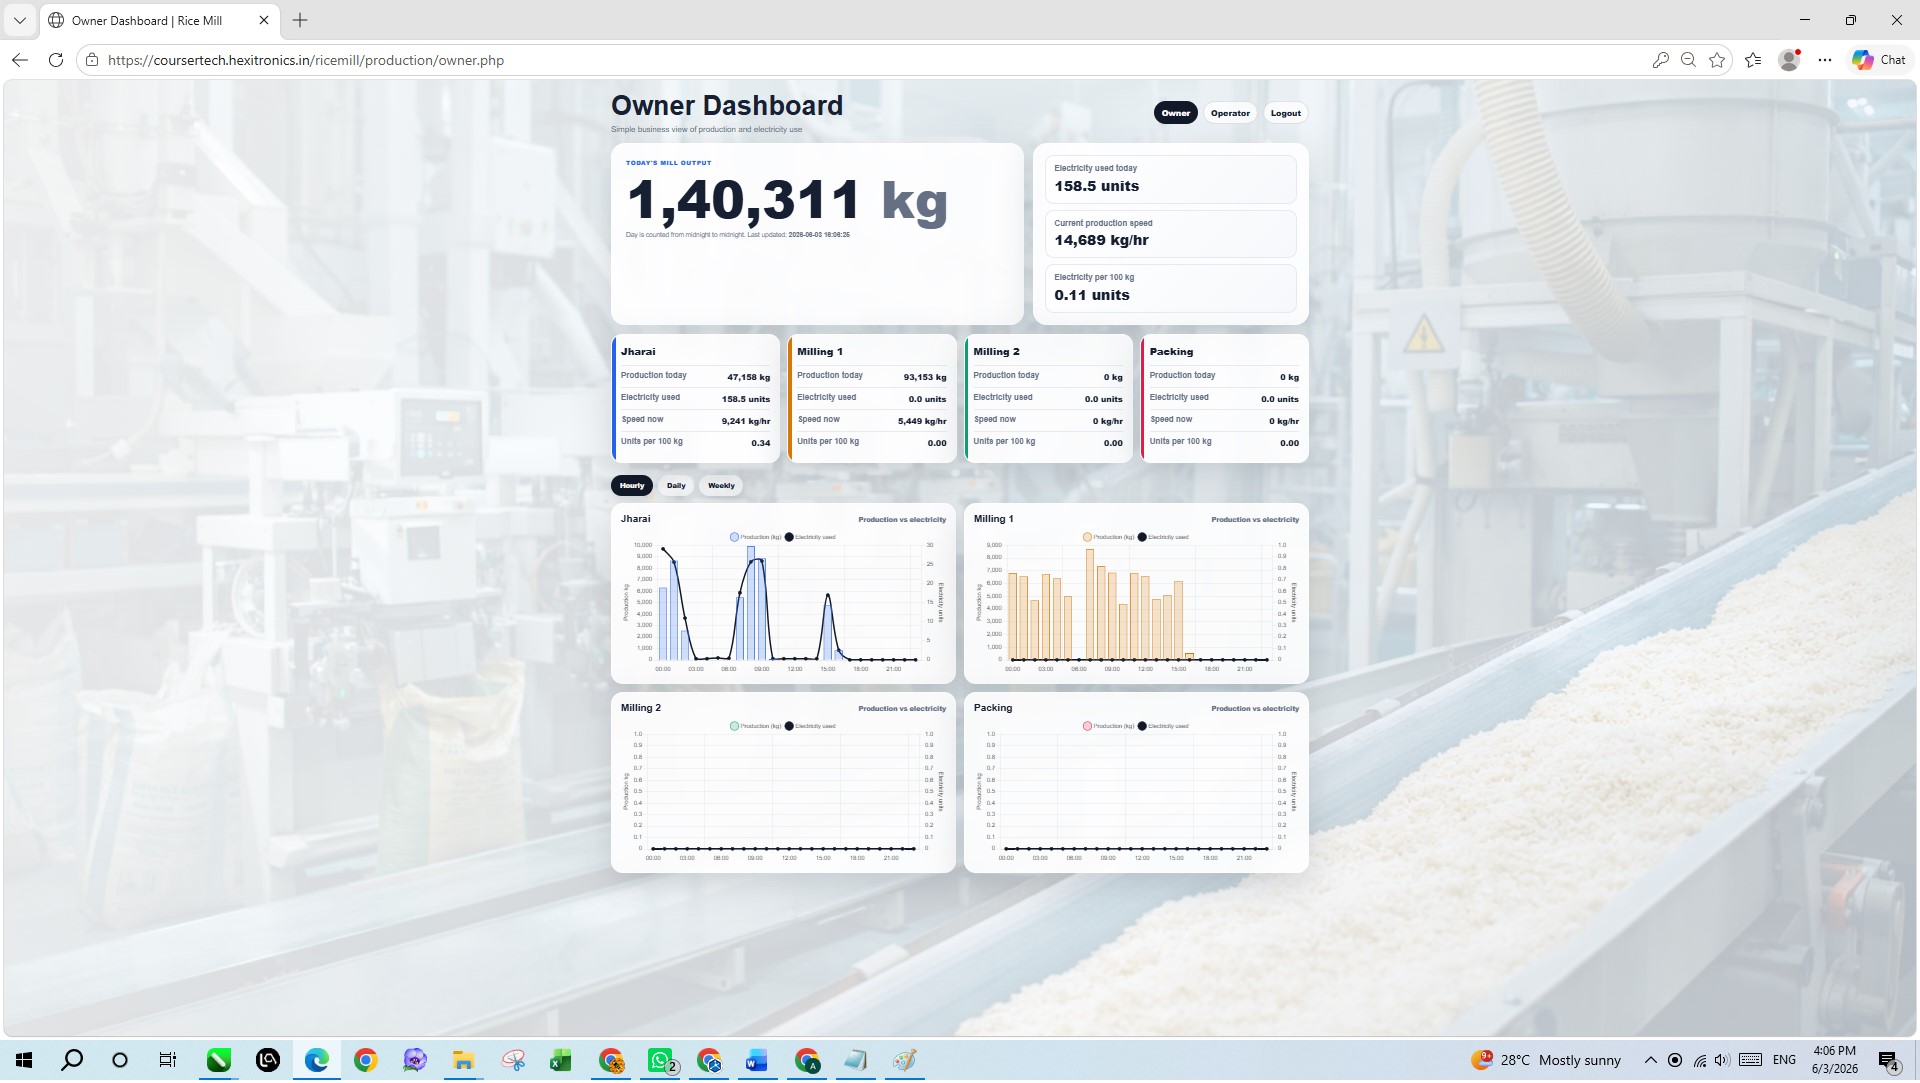
Owner View
Shows production output, energy used, and units per 100 kg for direct business review.
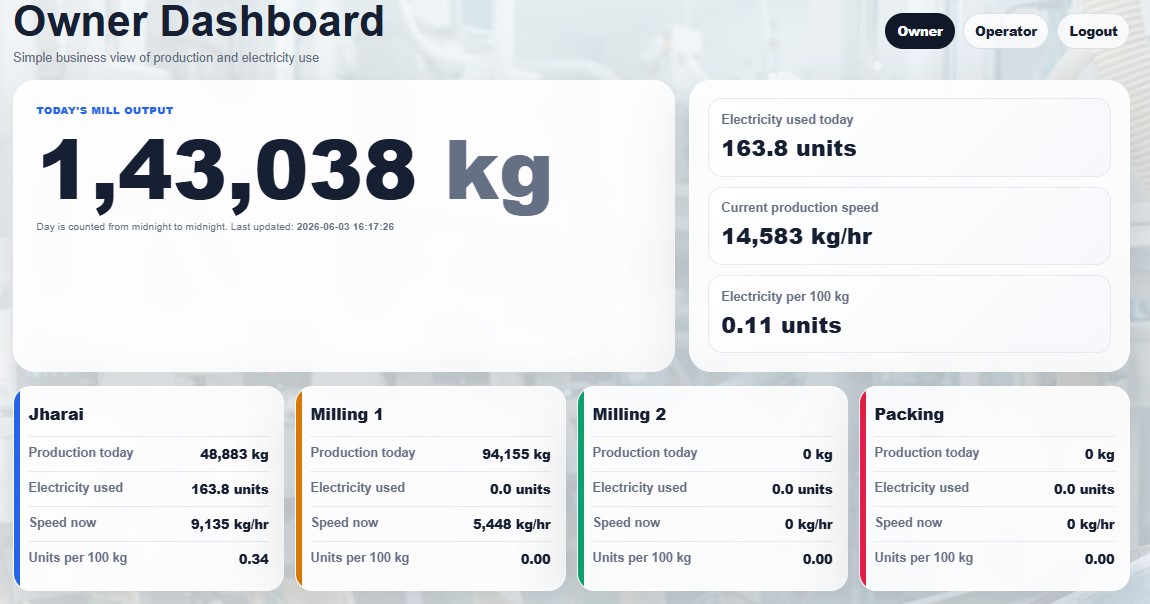
Performance Analytics
Production versus electricity graphs help identify which energy source is most effective at the plant level.
Benefits Delivered
For the Operator
The team can now chase the production target in real time, just like chasing a run rate in cricket. This improves accountability and keeps the shift focused on output.
For the Owner
The owner can directly see the cost impact of each energy source and decide which source is more economical for production planning.
Project Summary
This rice mill case study shows how Hexitronics converted raw energy and production data into practical decision-making tools. By connecting energy meters, load cell measurement, and dashboard analytics, the system provides both operational and financial visibility for a high-volume plant working on narrow margins.
The result is a clear view of how much the plant produces, how much it consumes, and how quickly the team must move to hit the target profitably.
Turn Plant Data into Profit Intelligence
Similar dashboards can be built for other process plants, packaging lines, utilities, and manufacturing systems where production rate and energy cost must be tracked together.